Top Page > Technical Info > Technical Notes

Technical Notes
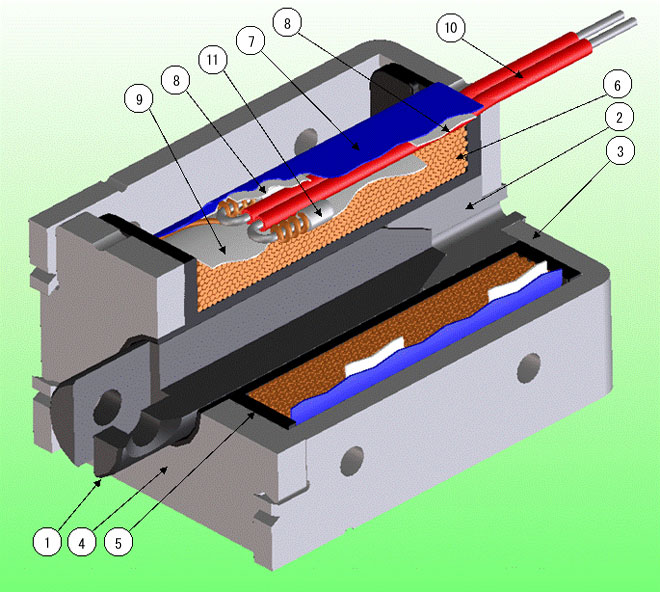
Open Frame Solenoid Structure and Components
| No. |
Part Name |
Material Description * |
Surface Finishing * |
| ① |
Plunger |
Free-cutting carbon steel SUM24L |
Fluoroplastic Coating |
| ② |
Plunger Stopper |
Free-cutting carbon steel SUM24L |
Haxavalent Chromium Free Zinc Plating |
| ③ |
Yoke |
Electrolytic Zinc-coated Steel Sheets SECC |
- |
| ④ |
Yoke Cover |
Cold Rolled Carbon Steel Sheets SPCC |
Haxavalent Chromium Free Zinc Plating |
| ⑤ |
Bobbin |
Polybutylene Terephthalates PBT |
- |
| ⑥ |
Magnet Wire |
Polyurethane Copper Wire UEW |
- |
| ⑦ |
Cover Tape |
Polyester Film Electrical Insulating Tape |
- |
| ⑧ |
Insulation Tape |
Polyester Film Electrical Insulating Tapen |
- |
| ⑨ |
Insulation Paper |
Nomex Insulation Paper |
- |
| ⑩ |
Lead-wire |
Heat Resistant PVC wire UL1007LF |
- |
| ⑪ |
Solder |
|
- |
*The structure, material, and surface finishing on the above chart is the specification for TDS standard Solenoids. These specifications can be customized to fit your requirement. Please feel free to consult with us.

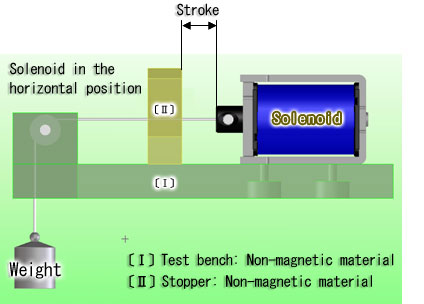
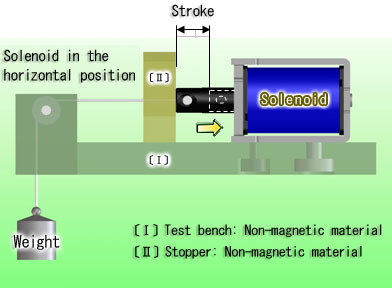
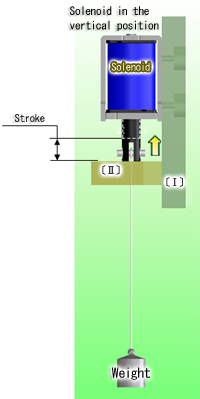
Pull Force Test Method (Weight method)
1.Testing Condition
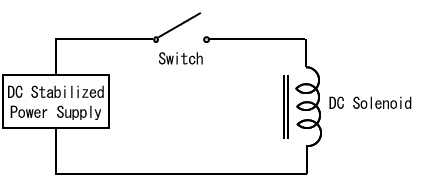
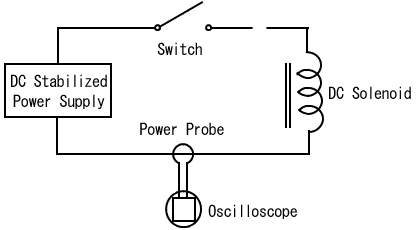
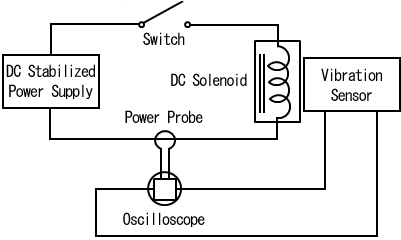
2.Testing Circuit
3.Testing
| (1) Environment |
Ambient Temp.: 20±2%, Relative Humidity: 65±5%, Atmospheric Pressure: 1013hPa.
The following test conditions may be accepted, only if it’s confirmed these conditions does not arouse doubts in the test result; Ambient Temp.: 20±15%, Relative Humidity: 65±20%, Atmospheric Pressure: 860~1060hPa.
|
| (2) Item |
① Pull Force: Weight Load Pull Method
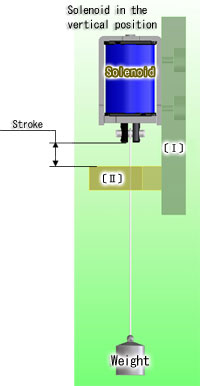
② Weight Load Pull Down Method
③ Weight Load Pull Down Method
|
| (3) Method |
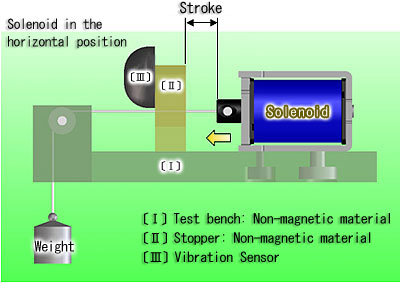
① Fix a Solenoid at a testing stroke.
② Set up a testing voltage in DC Stabilized Power Supply.
③ Turn on the switch (for MIN. 300ms) and check the heaviest weight load that Plunger is pulled to the fixed core completely.
For Solenoids specifying less than 300ms ON time, a required ON time shall be applied for testing.
|
Pull Time Testing Method
Pull Time is measured with oscilloscope in the testing circuit described as 2 below.
Using a current waveform displayed on the oscilloscope (3. (3)), a pull time for Plunger to travel from an original testing stroke position until it completes traveling.
When the current starts to flow in to the coil too rapidly, this current waveform cannot be instantly changed due to the seof- inducted back EMF proportional to the changes and causes current increase by the transient electric phenomenon live waveform.
Once the current gets bigger and the pull force increased over the load, plunger movement starts.
Current shall be decreased by back EMF when the plunger moves and current rapidly increases when the plunger movement stops.
1.Testing Condition
2.Testing Circuit
3.Testing
| (1) Environment |
Ambient Temp.: 20±2%, Relative Humidity: 65±5%, Atmospheric Pressure: 1013hPa.
The following test conditions may be accepted, only if it’s confirmed these conditions does not arouse doubts in the test result; Ambient Temp.: 20±15%, Relative Humidity: 65±20%, Atmospheric Pressure: 860~1060hPa.
|
(2) Method |
① Fix a Solenoid at a testing stroke.
② Set up a testing voltage in DC Stabilized Power Supply.
③ Turn on the switch and read pull time from a current waveform on the oscilloscope.
|
(3) Current Waveform |
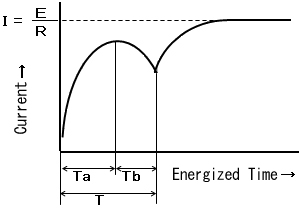 |
Ta: Plunger Travel Start Time
Tb: Plunger Travel Time
T: Pull time
(Plunger to complete a given stroke after switched ON.)
|
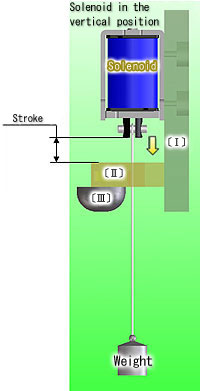
Return Time Testing Method
1.Testing Condition
2.Testing Circuit
3.Testing
| (1) Environment |
Ambient Temp.: 20±2%, Relative Humidity: 65±5%, Atmospheric Pressure: 1013hPa.
The following test conditions may be accepted, only if it’s confirmed these conditions does not arouse doubts in the test result; Ambient Temp.: 20±15%, Relative Humidity: 65±20%, Atmospheric Pressure: 860~1060hPa.
|
| (2) Method |
① Fix a Solenoid at a testing stroke.
② Set up a testing voltage in DC Stabilized Power Supply.
③ Solenoid is in energized state.
Turn off the switch, and Plunger returns and hits the Stopper. Read the waveform recorded on the oscilloscope.
|
| (3) Waveform |
|
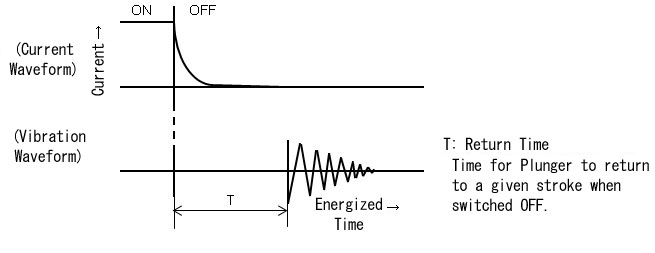 |
Temperature Rise Measurement Method
The resistance method and thermometer method are generally used to measure temperature rise of electric products.
Temperature rise of a solenoid may not be accurately observed by measuring the exterior temperature of the coil because the temperature gradient between inside and outside of the coil is considerably large.
Because solenoid temperature rise is caused by heat generation due to coil resistance, the resistance method, which utilizes the temperature coefficient of copper (0.00393=1/254.5 at 20℃), is used to measure solenoid temperature rise.
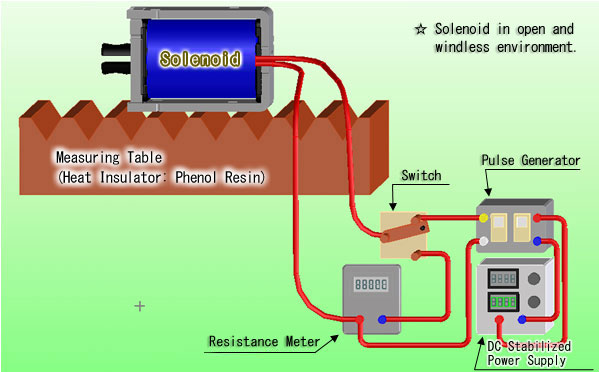
1.Measurement Condition/ Measurement Circuit
2.Measurement Method
① Place a solenoid on the measuring table and leave it stand for 2 to 3 hours in a room temperature.
② Connect wires as shown in the diagram above.
③ Set a specific voltage in the DC stabilized power supply.
④ Set a specific operation rating for the output of the pulse generator.
⑤ Before energizing, measure the initial resistance (R1) and ambient temperature (t1).
⑥ Energize the solenoid and measure the resistance (R2) and ambient temperature (t2) on the rise until they reach saturation.
Calculation of Temperature Rise
Temperature rise values can be obtained using the formula below.
θ = ( R2/R1 - 1 ) ( 234.5 + t1 ) - ( t2 - t1 )
| θ:Temperature Rise (K) |
t1:Ambient temperature before energized(℃) |
| R1:Resistance before energized(Ω) |
t2:Ambient temperature after energized(℃) |
| R2:Resistance after energized(Ω) |
|
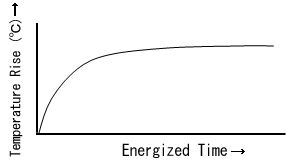
Solenoid Temperature Rise Characteristics
Based on the above measurement method and calculations, the relationship between temperature rise and energized time can be indicated as the diagram below.


 Access